
Infographics and Data Visualisation
· BlueHat Marketing
Infographics and Data Visualisation : What are they and how do they help your business?
The rise of the internet has brought with it massive amounts of raw data. Every online movement can be tracked, measured and archived, creating huge repositories of information that can hold valuable secrets. The problem is that raw numbers and statistics are difficult and tedious for the human mind to grasp. After all, our thinking is highly graphical and representational.
The key to unlocking the power of this raw information is to represent it in a graphical way that can illustrate trends and shape strategies. This can be done in two similar yet slightly distinct ways: infographics and data visualization .
Infographics
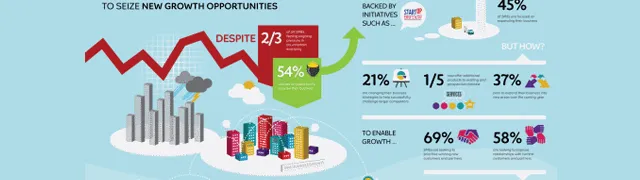
Infographics are visual representations of data or facts that are structured to enhance human understanding of a particular topic. Here’s an example:
Infographics are crafted by people seeking to illustrate a particular point through information. They involve selection of data and emphasis that is put based on the needs of the creator. Infographics are subjective interpretations of real data and are designed to create a compelling argument based on facts. For example, if you want to sell someone on the idea of optimizing their website for mobile display, an infographic illustrating the growing trends of smartphone users would be helpful.
Harnessing the Power of Data for Your Business
Both infographics and data visualizations can help businesses grow in their own way. Infographics can be used as powerful marketing tools that compel potential clients to act. They can also be used internally to bring forth the case for a particular marketing strategy or course of action. Data visualizations can be used in a more exploratory way to identify trends and areas of potential growth. They can also be used to objectively raise awareness of issues, reaching clients in sometimes striking ways.
Data Visualization
Data visualization is similar to infographics in that it is also a visual or graphical representation of data. The key difference, however, is that data visualization is an objective reflection of a data set , brought to graphical life through a computer program. It is a tool to help a human mind grasp the reality of a set of numbers or statistics, in order to bring out connections, trends, strengths and weaknesses.
In this example of an illustration of a blogosphere, one can see how clusters of linkages can form between sites, and how outliers branch out into dead ends. Visualizations can bring out a global picture of the reality within a certain area of study and raise awareness of issues therein. Understanding how complex systems like this work can unlock great power for a business seeking to maximize the effectiveness of its online marketing campaign, for example.

